What is your personal inflation rate?

Simply sign up to the UK inflation myFT Digest -- delivered directly to your inbox.
Frank Gaymond and his wife are comfortably well off: they are in well-paid jobs, have money saved in the bank and plan next year to renovate their home in a leafy corner of Buckinghamshire, one of Britain’s wealthiest counties.
And yet the rising cost of living has prompted the 32-year-old chartered surveyor to check the impact of soaring inflation on the household budget. He is among the first FT readers to use a new tool we have launched to help people calculate the impact of soaring inflation on their budgets.
The Gaymond inflation rate turns out to be a bit higher than the average, largely because their household bills are a bigger share of their overall budget. “I’m not surprised,” says Gaymond, who adds that their bungalow needs a lot of heating. “But I wanted to see how we compare with other demographics and now I can do that.”
The Gaymonds don’t plan any drastic changes in their spending but Frank has taken the precaution of replacing light bulbs with new low-energy alternatives and fitting smart plugs around the home - the sort that can be switched on and off remotely. He says: “I’m conscious that the economic conditions might get worse next year.”
The energy support package announced this week by prime minister Liz Truss will come as a huge relief to millions of Britons: as well as capping the average annual household energy bill at roughly the current level it will prevent the sharp hikes in general inflation that had been expected for the coming months. Instead of rising towards 15 per cent in the New Year, as some economists had forecast, it is now likely to remain around the current level of 10 per cent or so.
However, as the Bank of England has warned, the predicted increases in government borrowing needed to finance the support could feed inflation over a longer period. So UK householders will need to keep an eye on bills for a long time to come.
Our inflation counter is available to all readers, for free, at FT.com/personal-inflation-calculator. Divide your spending between the different categories — such as food, energy and holidays — and the specially designed FT calculator will work out your personal inflation rate. If you can bear it, you can enter your expenditure every month, as we will update the figures to take account of price changes.
In general, people who spend more of their money than the average on food, energy, cars and flying are now suffering the highest increases in personal inflation rates. Those who spend more than the average on housing costs have seen less of a jump — but this could well change as mortgage rates rise.
There is nothing new about personal inflation calculators, which were widely launched in the early days of the internet. But while inflation was low, householders had understandably little interest.
When FT Money wrote about inflation counters last November, as energy bills first started to leap ahead, we could find only one in service — at Rathbones, the wealth adviser. Now they are multiplying: starting at the Office for National Statistics, the government data office, which has relaunched its service.
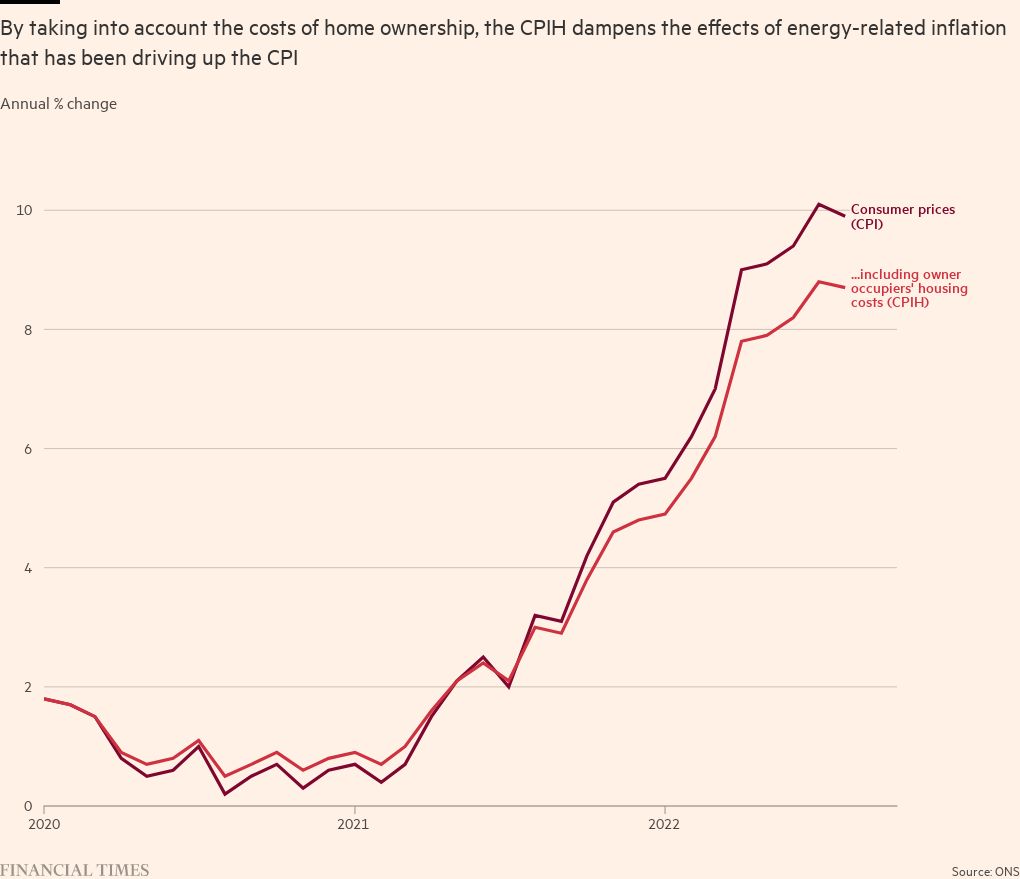
Like the ONS, we are not using the CPI, headline-making main consumer prices index, in our calculator, but the CPIH — the consumer price index including housing — which we think is more appropriate because it includes the housing costs of owner occupiers.
Right now, the CPIH is running below CPI because these housing costs respond only slowly to general inflation. In July, the latest month for which detailed ONS price data is available, CPIH was 8.8 per cent versus CPI at 10.1 per cent.
These are the national averages. So why bother to work out a personal score? Because inflation rates differ between households — and by much more than you might think. These differences did not appear large when the average CPIH inflation rate was 1.0 per cent, as it was in 2020, or even 2.5 per cent, as last year. But now that the average CPIH rate is closing on 10 per cent, the differences in rates between different types of household become startlingly significant.
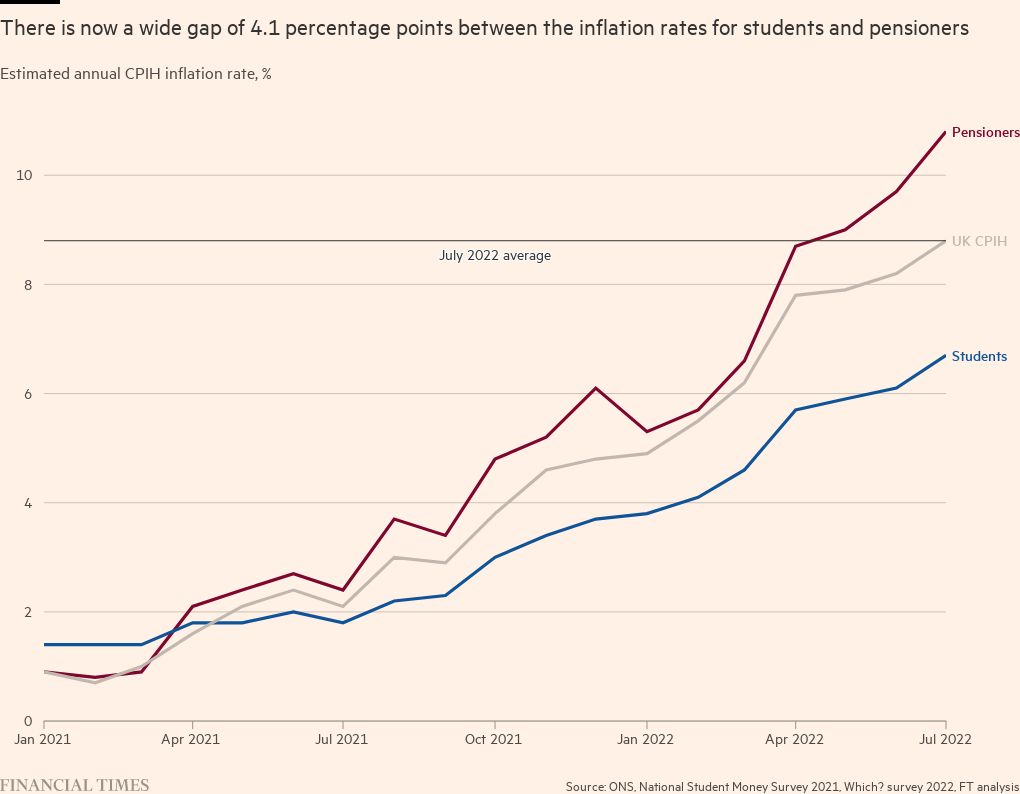
For Frank Gaymond, with his larger-than-average household bills, the figure is 9.3 per cent. Another FT reader, living with his wife in retirement in the West Country, is on 11.9 per cent, mostly due to taking plenty of holidays, which have seen prices rise rapidly due to fuel costs and labour shortages. But for students, who typically spend less on energy and don’t drive cars, the figure is only 6.7 per cent.
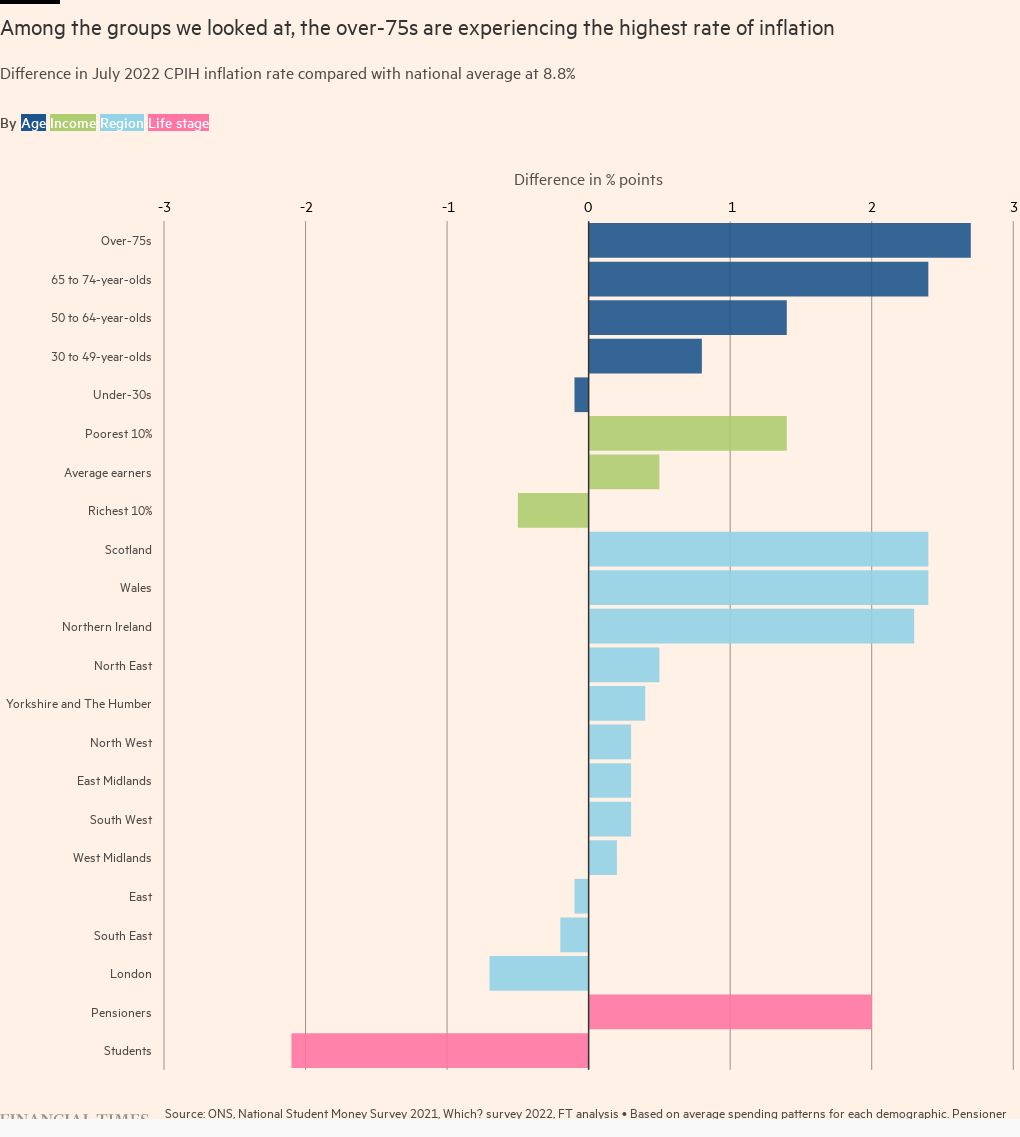
The poorest householders — who spend more of their money on food and energy than the average — have seen the largest increases of any income group. Our chart below shows that, based on family spending data and the CPIH index, the poorest 10 per cent of the UK population saw inflation running at 10.2 per cent in July, compared with 8.3 per cent for the richest 10 per cent — a rich-poor gap of 1.9 percentage points. Or to put it more starkly, prices were going up by nearly a quarter faster for the poor than the rich.
Jack Leslie, a senior economist at the Resolution Foundation, a think-tank focusing on low-income households, says: “These are the biggest differences we have seen [since data collection began in 2006].”
There are many ways of highlighting the differences between households. By age, the over-75s are likely to be experiencing the highest inflation rates (including housing costs) — 11.5 per cent in July, because they are likely to spend the most on heating. By contrast, the under-30s saw inflation of 8.7 per cent.
This is a sharp shift from early 2021 when, before energy prices took off, pensioners saw lower inflation than students — a change which highlights how much personal inflation rates matter.
Where you live also matters. Londoners saw the lowest July inflation rate of any region — 8.1 per cent — compared with 11.2 per cent in Scotland and Wales, which saw the highest levels. Northern Ireland on 11.1 per cent was just behind followed by the north east of England on 9.3 per cent.
The London rate is low because Londoners are less likely to use cars than other Britons and are less exposed to higher petrol prices. Plus, London residents tend to have smaller-than-average homes that are better insulated than most and therefore smaller-than-average heating bills. Also, the south is significantly warmer than the north. At the Resolution Foundation, Leslie says: “People living in rural areas in Scotland often have poorly-insulated homes and they have to commute long distances. There are huge regional disparities in the UK.”
Inflation rates: boosters vs reducers
You will increase your rate of inflation if you spend more on these:
Energy bills
Buying and maintaining a car
Fuel
Flying
Groceries
(Based on July 2022 prices)
You will reduce your rate of inflation, if you spend more on these:
Public transport
Rent/mortgage
Hobbies and tech
Health, education and social care
Financial services
(Based on July 2022 prices)
Consumer champion Martin Lewis has provoked controversy by calling the impact of rising energy prices on the cost of living “a catastrophe”. This week’s government package will protect people from future increases by capping domestic fuel costs at around current levels.
But the burden on poorer households remains severe: the Joseph Rowntree Foundation estimates that in the year to April 2022 those in the lowest 10 per cent by income were already spending around 10 per cent of their budget (after housing costs) on electricity and gas.
Wealthier households are insulated from the worst effects of the energy price rises because they typically spend a much smaller share of their budget on electricity and gas: 3 per cent for most such families, according to FT calculations. Moreover, richer households often have a savings cushion, which was bolstered during the pandemic, even as poorer families ran down their funds and often had to take on more debt.
However, these generalisations don’t cover everybody. Among wealthier households, people with multiple homes are seeing energy spending taking a much larger chunk of their budgets. So are those whose routine involves a lot of long-distance car travel — Londoners with weekend homes in Cornwall or the Lake District, for example.
FT survey: How are you handling childcare challenges?

We are exploring the impact of rising childcare costs around the world and want to hear from working parents about what you think governments and employers should be doing to help. Tell us via a short survey.
At Rathbones, Edward Smith, co-chief investment officer, says he sees little sign of the firm’s affluent clients changing their spending habits. But they are concerned about limiting the damage done to the real, inflation-adjusted, value of their portfolios. Smith says there is little that can be done in the short term — the answer is to invest in assets that offer longer-term inflation-protection, such as companies with strong market positions that can maintain their margins by passing on costs to customers.
However, as Gaymond’s example shows, even the comfortably well-off can benefit from paying more attention to their budgets. He says it’s very important to keep saving, if you possibly can, just in case there is more bad news around the corner. “If I’m made redundant, I want to know there is something for a rainy day.”
To keep saving, you need to have a close eye on the price of the goods and services you are buying. That’s why we have launched the FT inflation calculator. Anybody can use it, and keep using it as we work our way through what is likely to be — in economic terms — the toughest winter in decades.
Why use our personal inflation calculator?

Quick to complete and repeat: We’ve customised spending categories to ensure they are as intuitive as possible and to make the calculator easy to use over the coming months as price changes are released. Our custom categories reflect all the items in the ONS national basket — we’ve just rearranged the groups.
Plan ways to reduce the impact of inflation: When using the tool you can instantly see the impact that tweaks to spending have on your overall inflation rate. You can see how adjusting non-essential spending could reduce your inflation rate.
Take into account international spending: Our calculator is currently available to readers in the UK, US and Japan. If you regularly spend time in any combination of these three countries you can use our calculator. We plan to add more countries. Tell us which to prioritise, email money@ft.com
What does my personal inflation rate actually mean?
Your personal inflation rate represents the percentage change in the total cost of your personal “basket of goods” for a given month compared with the same month one year ago.
For example, if you have a personal inflation rate of 10 per cent, the same basket of goods would cost you 10 per cent more now than it did 12 months ago.
Note that a high personal inflation rate is not the same as financial hardship. For example, a student with a below-average inflation rate of 6.7 per cent will be struggling more with the rising cost of living than a wealthier pensioner with an above-average inflation rate of 10.8 per cent, as the student will probably have limited options for cutting spending.
Why have you used the CPIH instead of CPI?
The inflation rate reported in headlines is typically the CPI, or Consumer Price Index. This measure of inflation excludes the cost of owning a home, because property ownership is considered as a capital, rather than consumable, good.
However, the cost of owning a home is significant in a household budget so we have used the CPIH, which is the CPI plus imputed rental costs for homeowners, which acts as a proxy for owner occupiers’ housing costs.
It does not measure the change in the value of a house. CPIH is currently lower than CPI because average spending on owned homes is higher than average spending on rented homes. So housing takes up a higher share of the CPIH basket, which dampens the effect of energy-related inflation.

Comments