When the long run in markets goes wrong

Roula Khalaf, Editor of the FT, selects her favourite stories in this weekly newsletter.
The writer is a financial journalist and author of ‘More: The 10,000-Year Rise of the World Economy’
It is a truth universally acknowledged that equities will always go up in the long run. But anyone who backed a fund based on the UK’s FTSE 100 index must be starting to have their doubts.
On the last trading day of the second millennium, the index marked a then record high of 6,930.2, a story this journalist reported for the Financial Times.
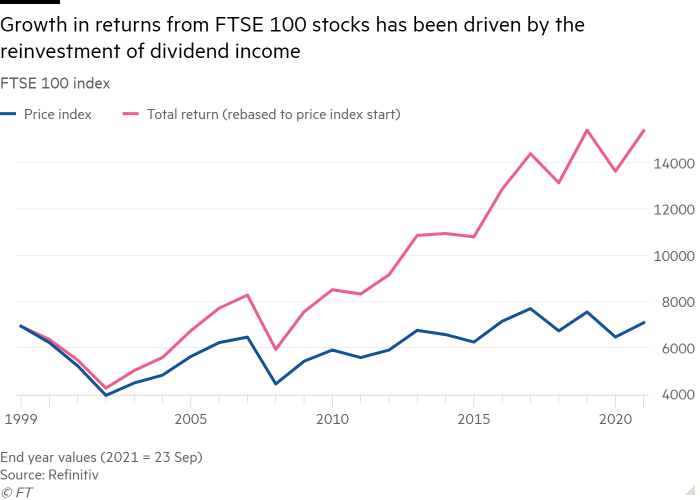
But the index did not pass the 7,000 level until March 2015, and was below its end-1999 level during trading last Monday. While the index has gone nowhere, at least the total return has been positive.
Thanks to the reinvestment of dividend income, the annualised return for the FTSE 100 was 3.3 per cent between the end of 1999 and December 31, 2020.
But that is not the kind of return that many investors were expecting back in 1999. And the importance of dividends is slightly ironic, given that back then, counting on income was seen as a very old-fashioned way of approaching equity investment. Many technology companies did not pay dividends at all.
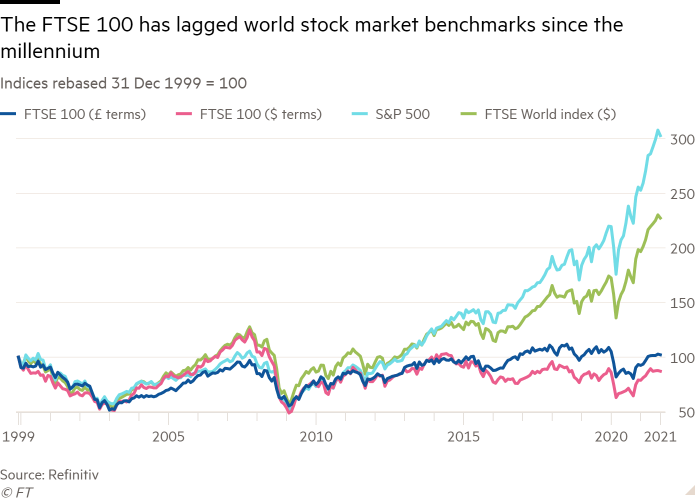
Why has the index performed so badly? In part, this was because the end of the millennium coincided with the peak of the dotcom boom when share prices were bid up to inflated levels.
But Wall Street was also involved in the dotcom bubble and its leading indices have performed much better; both the S&P 500 and the Dow Jones Industrial Average are around three times their end-1999 level.
A better explanation may lie in the composition of the index. There has been an enormous rate of turnover in FTSE 100’s constituents; less than half those in the benchmark at the end of the last millennium are still there.
Of those, five are banks (Barclays, HSBC, Lloyds, Standard Chartered and Royal Bank of Scotland now renamed as NatWest) which have had a chequered 20 years to say the least. They are the survivors of a much larger group that included Abbey National, Alliance and Leicester, Halifax, and Woolwich.

Many of the other long-lasting constituents are from traditional industries like food and drink (ABF, Diageo, Whitbread), supermarkets (Sainsbury and Tesco), tobacco (Imperial and BAT), mining (Anglo American and Rio Tinto) or insurance (Legal & General and Prudential).
What the FTSE 100 lacks are the kind of exciting technology companies that have performed so strongly on Wall Street; the Amazons, Facebooks and Googles. Sage is the sole tech company to remain in the index from the December 1999 list; the likes of Arm, CMG, Logica, Misys and Sema have been swallowed up in acquisitions while Energis went into administration.
There are not many stocks in the current FTSE 100 to set investors’ pulses racing and that is reflected in the way that the market is rated, relative to Wall Street. Stocks in the FTSE 100 index trade on an average price equivalent to 18.4 times their previous 12-month earnings, compared with the S&P 500 index’s ratio of 31.4.
Of course, that difference could conceivably imply that UK equities are much better value than American shares right now.
It could also imply that long-run investing may not pay off on Wall Street from current levels. After all, the UK is not the only market to disappoint over the long run. In Japan, the Nikkei 225 is still well below its end-1989 level.

Back at the end of the 1980s, many investors believed that conventional valuation approaches did not apply in the Tokyo market, because the big Japanese companies like Toyota and Sony had discovered the secret of long-term growth.
Such was the enthusiasm that the Japanese stock market comprised 44 per cent of the FT World Index, far above its share of global GDP.
So there is more than one reason for equities to struggle over the long run; the UK had too great a reliance on stodgy sectors whereas Japan simply reached a valuation level from which further gains were unlikely.
Step forward to 2021, and investors so love the big American tech companies that the US market is more than 58 per cent of the FT World Index.
Investors have long stopped worrying about conventional valuation measures like a low dividend yield or a high cyclically adjusted price/earnings ratio since they have not been a barrier to market rises in the past. American equities will always go up, they think.
Of course, in 2007, they thought the same thing about US house prices. And we all know what happened then.
Comments