How investors should navigate the slump in IPOs

Roula Khalaf, Editor of the FT, selects her favourite stories in this weekly newsletter.
The writer is founder and chief executive of Trivariate Research
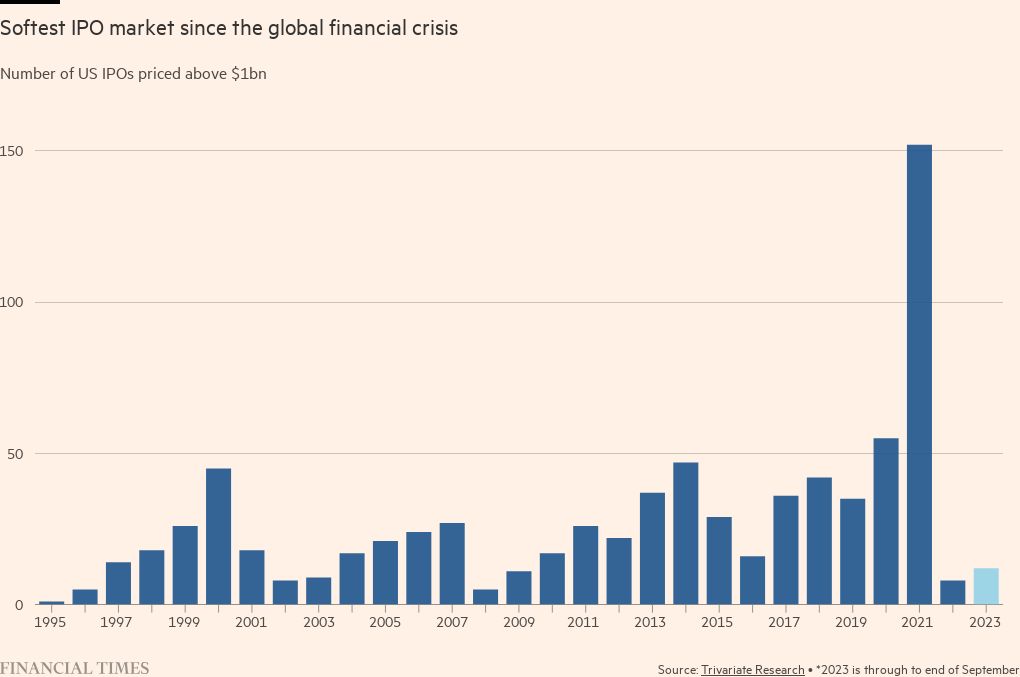
The last two years saw the lowest two-year total in the US of initial public offerings by companies with a value of $1bn or more since the financial crisis of 2007-08. With strong nominal economic growth and the enormous recovery in the stock market in 2023, investors may wonder about what more might be needed as a catalyst for a more robust IPO market in 2024.
It appears that higher interest rates and concerns about a recession that has yet to materialise have been the key reasons for the weak IPO calendar. Another factor, however, is that many of the offerings have been priced incorrectly.
Since 1995, the first-day gain in stocks from their IPO price has been 16.3 per cent above the average price move for their industry on the session. During the dotcom bubble of 1999 and 2000, first-day closing prices of IPO stocks were double the offering level on average. That euphoria has yet to be duplicated, though the IPOs in 2020 saw an average of 50 per cent first-day returns relative to the S&P 500. Given the persistence of this day-one IPO performance, buyers that have access and do not have stringent turnover requirements garner relatively risk-free profits.
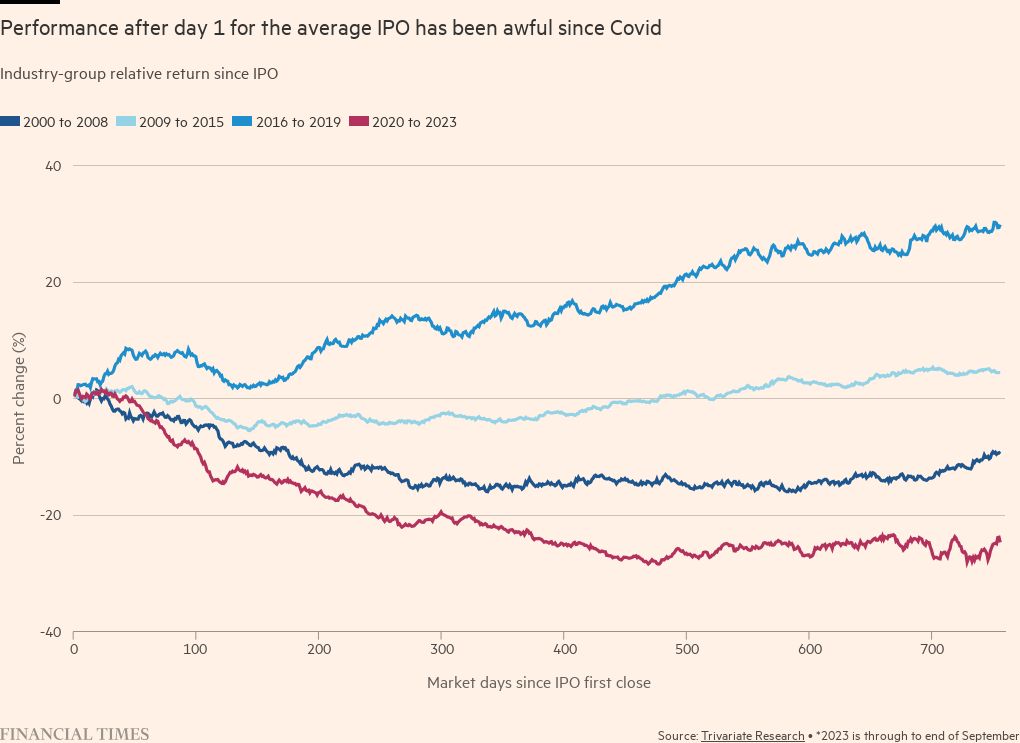
But the challenge for many longer-term investors has been IPO performance after the first day of trading. Since 2020, the relative return of average IPO measured from its day one closing price has lagged behind its industry group by more than 20 percentage points after the first year. More than 60 per cent of IPOs have lagged behind their industry averages by more than 15 percentage points after a year.
A fraction of this weakness reflects the post-pandemic unwind of the “Spac-palooza” in the flotations of so-called special purpose acquisition companies that seek to raise funds and then find takeover targets. But IPOs from day two and beyond performed poorly from 2000-2008 and generated no excess return versus industry averages in 2009-2015. They only worked well on average in 2016-2019 as markets continued to recover from the financial crisis with central banks keeping interest rates low, extending the “free money” era.
Given this challenging backdrop, there are a few important considerations for IPOs that we recommend to boards, corporations, advisers and lawyers.
First, there is an optimal percentage range of the total shares to float at the IPO. Companies that float less than 40 per cent of outstanding shares at IPO underperform for the next year.
The constant spectre of additional supply hitting the market 90 to 180 days after the initial offering when lock-ups expire weighs on long-term investors, who prefer to wait for those “clearing events” before building large positions. However, too much “free float” of stock not held by controlling shareholders is also a red flag. IPOs floating more than 75 per cent of their shares at the IPO also tend to lag behind.
Management teams that retain relatively insignificant positions will ultimately not capitalise on the long-term wealth creation of their entities. Hence, free floating 45-70 per cent of shares at the initial offering has historically been best.
Second, the existence of a “majority seller” — a holder of 50 per cent or more of the shares at the time of the IPO — matters. We evaluated the success of IPOs depending on whether they had a majority seller. IPOs with no majority seller strongly underperformed their industry-group averages. The performance spread between IPOs with and without a majority seller was statistically significant both after the first year and in the long run. Having a large initial backer of an IPO on average provides focus and discipline during the process.
Third, the profit margin of the company at the time of the offering was important to the ultimate performance of the stock. IPOs with gross margins near their industry averages perform best. Companies with lower margins than their industry-group averages may indicate structural issues that could persist for an extended period. The companies in the bottom two quintiles of gross margins compared with industry averages underperformed by 15 per cent percentage points or more over the first year. IPOs with gross margins 3 to 6 percentage points higher than the industry-group average perform best.
Until interest rates sustainably decline or investors believe it is more likely that the economy expands than we enter a recession, we suspect the IPO market will stay muted.
Our judgment is that fundamental investors should focus on the variable pay packages of the senior management teams of IPO companies. That should provide clues on what management thinks is the path of profit margins and when they can sell their share holdings — two vital factors for IPO performance.

Comments