And the winner is . . .

Roula Khalaf, Editor of the FT, selects her favourite stories in this weekly newsletter.
Three correct entries for this week’s chart quiz. Given an uneven difficulty level, that’s fairly good. Here’s what they said:

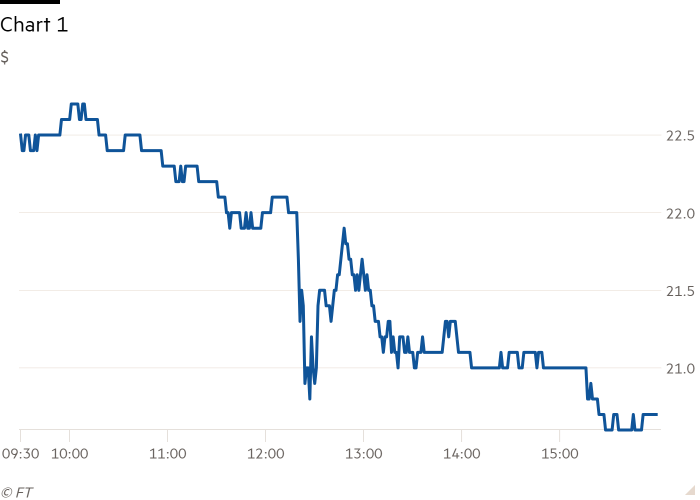
That’s the share price of Blackstone Mortgage Trust on December 6, the day Muddy Waters revealed it was short. (Apologies to the reader who put time into working out the exchange based on the tick size; it’s just NYSE. We had to set the ticks very wide so intraday data didn’t break our chart builder tool.)

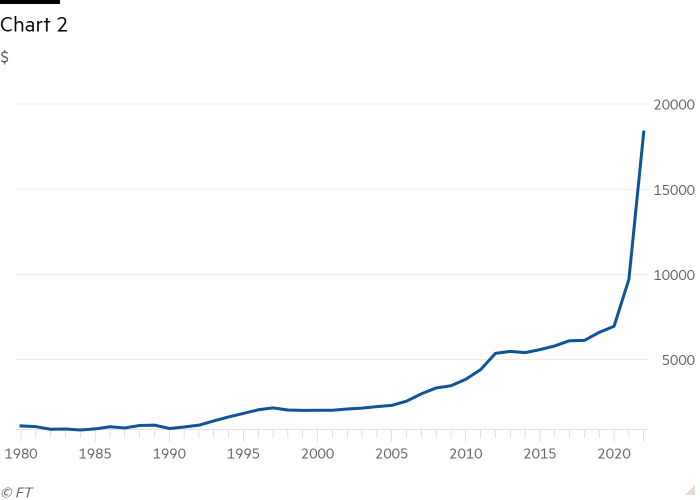
Tough one, but IYKYK. It’s the World Bank’s Guyana GDP per capita estimate. If it had you stumped, MainFT offers ample coverage of how it happened and what might happen next.

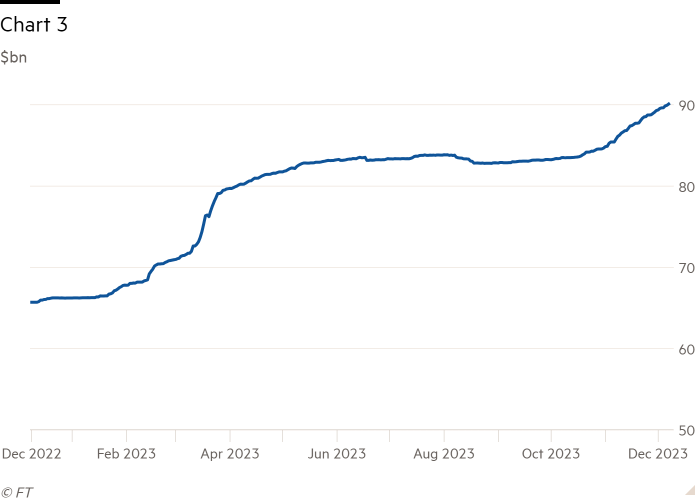
Tether’s market cap. We welcome in the comment box any explanation as to why approximately $23bn in tether has been minted this year that is not “to make bitcoin go up.”
The wheel of fortune landed on . . .

. . . who’s Leo Saenger, an investment analyst at Boston hedge fund Bracebridge Capital. He wins a money-can’t-buy exclusive FTAV T-shirt.
A chance for you to do the same will come again on Friday.
Comments