Education: around the world in charts
Simply sign up to the Education myFT Digest -- delivered directly to your inbox.
From differences in school completion and literacy between wealthy and low-income countries, to policymakers’ targets and where the money comes from.
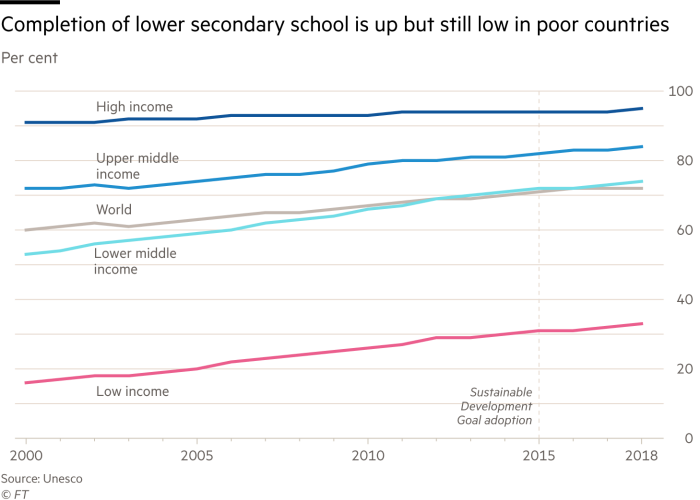
The proportion of pupils who complete lower secondary school (typically 12-15 years) has increased but in lower-income countries remains far below the global average. UN Sustainable Development Goal 4 targets completion of secondary education to specified learning outcomes by 2030

Almost 90 per cent of 10-year-olds in the poorest countries cannot read with basic understanding, compared with fewer than 9 per cent in the richest
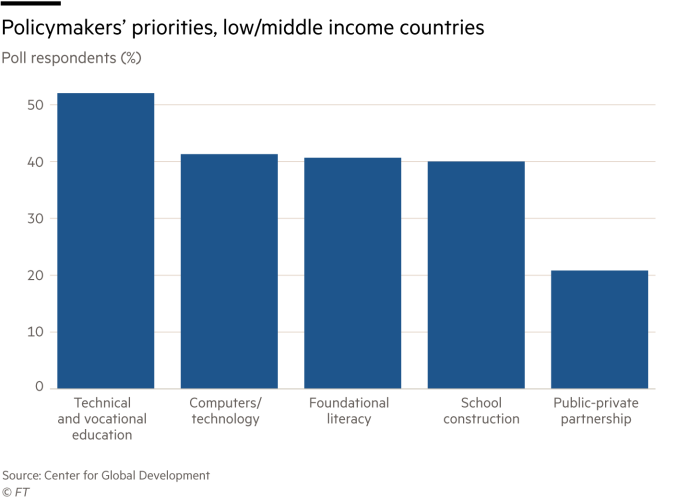
Policymakers surveyed in 36 low and middle-income countries prioritise technical and vocational training and computers/technology above foundational learning of basic literacy skills
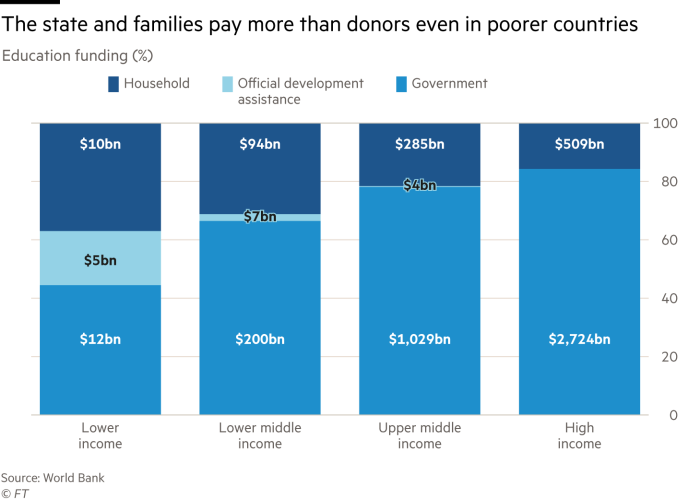
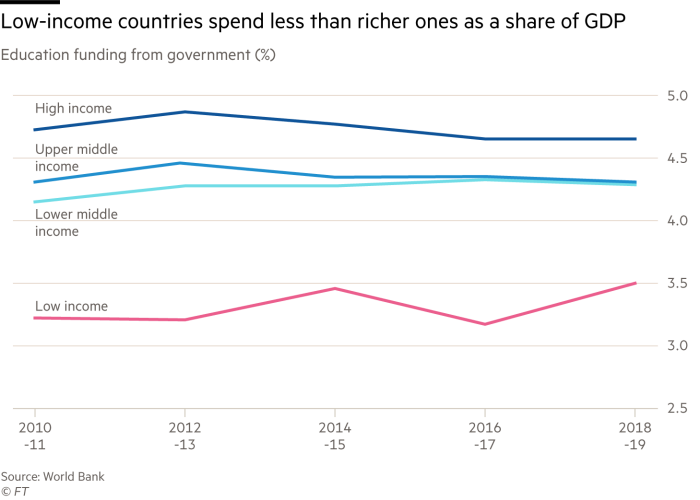
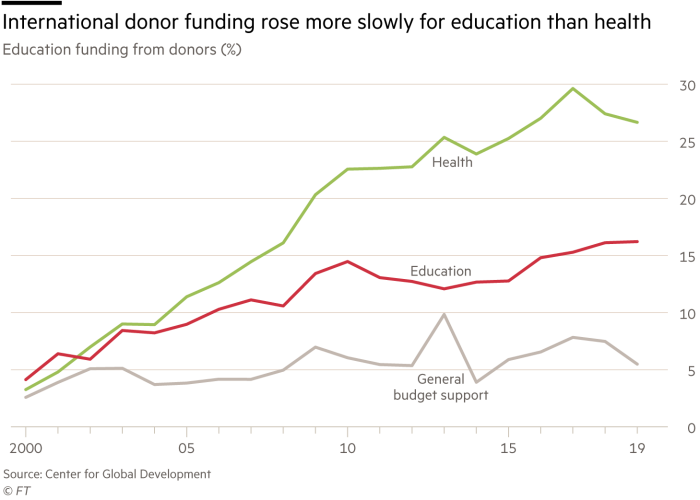
Funding (top to bottom): donor support is the smallest source of school financing even in poorer countries; lower-income countries spend a smaller share of GDP; donor education funding has risen more slowly than health funding

Comments