John Authers: US stock valuations have been inflated by the Fed
Roula Khalaf, Editor of the FT, selects her favourite stories in this weekly newsletter.
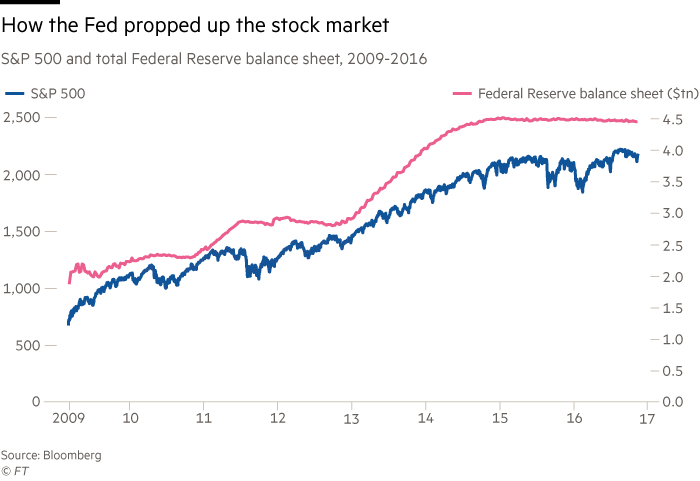
If you want to understand the bizarre decade that markets have experienced since the financial crisis, you cannot do better than to look at the S&P 500 — the main index for US stocks — compared to the expansion in the Fed’s balance sheet.
The central bank has bought bonds to try to push down their yields and so push up the valuations that people will put on stocks — and they have been phenomenally successful.
Since hitting rock bottom in March 2009, the S&P 500 has more than trebled and the rally over that period has been remarkably in tune with the Fed’s bond-buying. There was a hiatus during 2011 when the Fed was not buying, and stocks hit a plateau again once the buying programme was finally over in 2015.
Which leads to the big question for the future. Stocks look very expensive by any measure other than when you compare them to bonds, in which case they look cheap. What will happen to the US stock market when the Fed — as it must — starts to reduce its balance sheet?


Comments