ETF investing plummets to lowest level since Covid crisis hit

Simply sign up to the Exchange traded funds myFT Digest -- delivered directly to your inbox.
Latest news on ETFs
Visit our ETF Hub to find out more and to explore our in-depth data and comparison tools
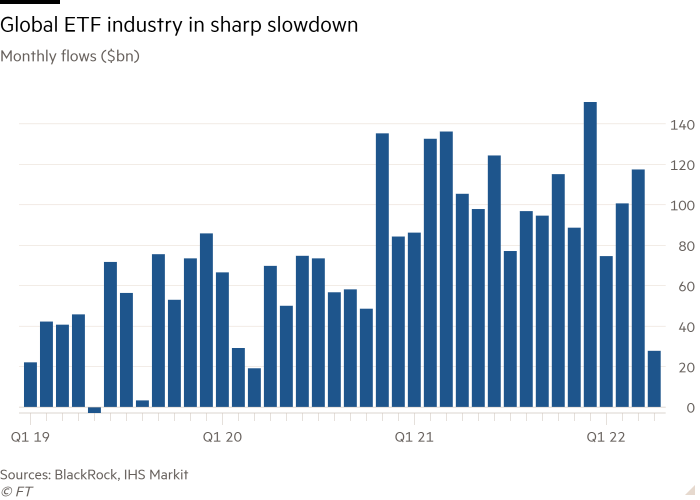
Purchases of exchange traded funds fell in April to their lowest level since the depths of the Covid crisis as the war in Ukraine and spiralling global inflation sapped demand.
Net inflows to ETFs and exchange traded products globally slipped to $27.4bn in April, according to data from BlackRock, down from $117.4bn in March and the lowest figure since March 2020.
Equity funds were particularly badly hit, with inflows slowing to a trickle of just $2.8bn, compared to $76.2bn a month earlier.
The near-standstill coincided with turbulence in equity markets, with the FTSE All-World index slumping 8.1 per cent in April, taking its year-to-date losses to 13.2 per cent, amid the growing threat of stagflation.
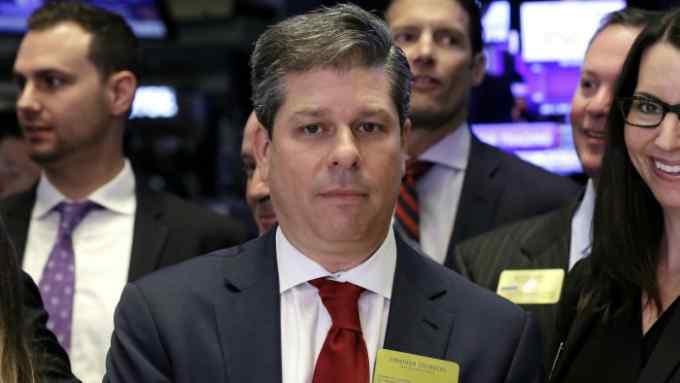
“We have seen a significant drop-off in headline equity flows,” said Karim Chedid, head of investment strategy for BlackRock’s iShares ETF arm in the Emea region.
Nevertheless, he said although there was an element of de-risking, “I wouldn’t say it’s a dash for cash by any stretch of the imagination”.

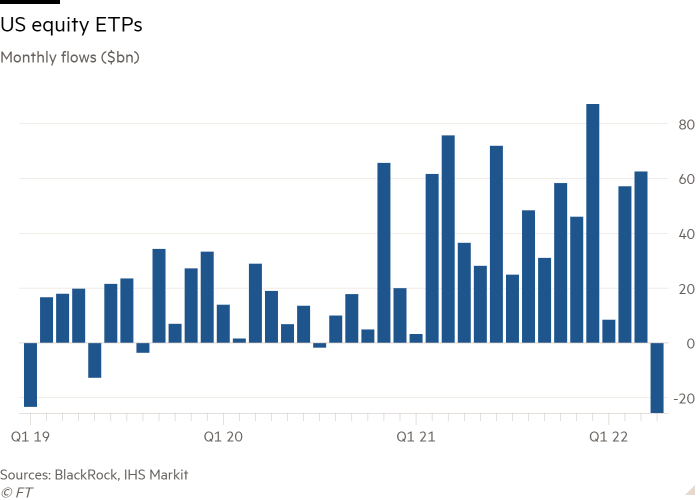
The souring mood was most noticeable in the US, with a net $25.6bn withdrawn from equity ETFs focused on Wall Street, while there were far smaller outflows from European equities and net flows into broad developed market vehicles, emerging markets and Japan.
Morningstar data showed that three large core US equity ETFs: iShares Core S&P 500 (IVV), SPDR S&P 500 (SPY) and Vanguard S&P 500 (VOO) each bled between $10bn and $12bn in April — a far cry from March when all three had been in the top five nationally for inflows.
The $10.2bn pulled from VOO was the largest monthly outflow from any Vanguard ETF on record, according to Morningstar.

Moreover, the outflows from these three funds meant iShares, Vanguard and State Street, the three industry leaders, each saw outflows from their global ETF complexes in aggregate in April, its data showed.
Chedid argued these outflows were largely driven by a technical factor: futures contracts currently trade at a discount to broad market indices, “so some institutional clients have switched in the past month from US equity ETFs to futures”, he said.
“Flows of this size are typically tied to the derivatives markets,” Chedid added. “It’s important to keep in mind, however, that these outflows don’t represent investor selling or a shift in sentiment — just a shift in the way they get exposure to the underlying index.”
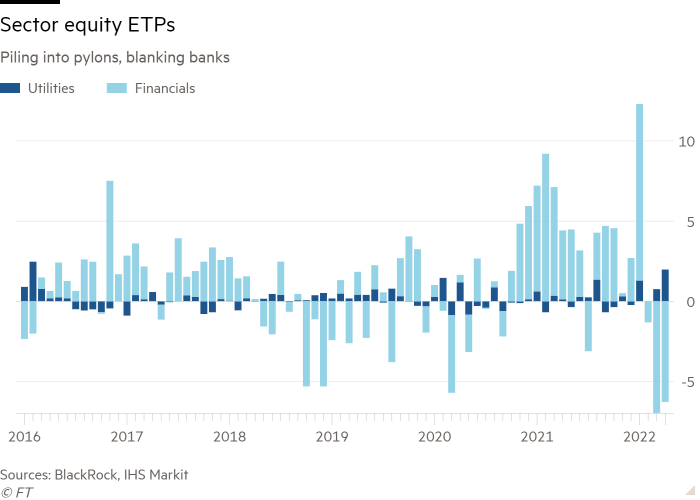
At the sector level there were clear signs of investors adopting a more defensive stance. Healthcare ETFs attracted a net $3.6bn, BlackRock said, while the $2bn piped into utilities funds was the most since February 2016 and the third-highest figure on record.
A further $6.3bn was pulled out of financials ETFs, meaning the sector is now in the red year-to-date — despite chalking up an all-time monthly record inflow of $10.9bn in January.

The $11.7bn scooped up by emerging market equity ETFs, up from $6.6bn in March, may seem to run counter to this mood of risk aversion. However BlackRock said it was largely driven by demand for Asia-listed China funds, suggesting some local investors may see signs of value starting to appear in beaten-up Chinese stocks.
Wariness was also the order of the day in fixed income, even if overall inflows only dipped to $18.8bn, from $25.5bn in March.
Government bonds ETFs drew in $15.9bn, a figure exceeded once before, in November 2018. In contrast, flows to higher risk investment grade corporate bonds fell from $3.3bn in March to $1.2bn, and turned negative in the eurozone.
Further still up the risk curve, high-yield bond funds bled $3.5bn, hit by net withdrawals in both the US and Europe.
Circumspection was also the order of the day in terms of duration, with short-term maturity funds attracting $7.5bn, far more than the $1.8bn soaked up by long-term ones.
Nevertheless Chedid said there were signs of some animal spirits starting to return in the most recent data, with investment grade yields of just under 4 per cent looking attractive to some, a trend he thought “had legs”, and duration positioning “coming back from extreme levels”.
Ryan Jackson, manager research analyst at Morningstar, also pointed to some signs of risk appetite in the US ETF market, with leveraged equity funds attracting a net $5.2bn in April.
Within this, the Direxion Daily Semiconductor Bull 3x ETF (SOXL) and ProShares UltraPro (TQQQ), both of which offer triple exposure to technology-focused indices, sucked in $2.3bn and $1.9bn, respectively.
“Investors in these ETFs seem to be channelling the proverbial ‘buy the dip’ mentality, trying to capitalise on these benchmarks’ recent woes,” Jackson said.
However, with losses mounting — SOXL has fallen 37 per cent since the start of April and TQQQ 38.4 per cent — Jackson said investors had been “early to the party” and only “time will tell” if they continue to double-down on such punchy bets.
Latest news on ETFs
Visit our ETF Hub to find out more and to explore our in-depth data and comparison tools

Comments