How we compiled the FT-Nikkei Investing in America ranking

Roula Khalaf, Editor of the FT, selects her favourite stories in this weekly newsletter.
In 1838, Charles Darwin was deciding whether to propose to his cousin Emma Wedgewood. To help make up his mind, he wrote down all of the reasons for and against marriage. Reasons in favour included “constant companion (and friend in old age)”, while reasons against included “forced to visit relatives” and “terrible loss of time”.
Deciding which US cities are most attractive to foreign investors should be a less emotionally fraught exercise. But in one respect the decision is not that different from Darwin’s: it means choosing what matters, and how much.
To produce the FT-Nikkei Investing in America ranking, we compiled data on the economic, regulatory and social characteristics of US cities and the preferences of overseas investors. Combining that data into an overall ranking involved making judgments about what matters to a diverse group of people with different individual goals.
Overall, we’re confident that our approach has created an interesting and meaningful index. But it is important to recognise that other people could have made different choices with the same data. So here we explain what we could have done differently, and why we made the choices that we did.
Choosing the cities
We limited our selection to cities in 50 states and DC with a population greater than 250,000, based on 2020 Census place data.
Last year, these cities captured 45 per cent of all new foreign business projects in the US, roughly a fifth of the country’s greenfield foreign direct investment — that is, cross-border investments that create new jobs and facilities — according to fDi Markets, an information provider owned by the Financial Times. This doesn’t mean that rural areas are not attractive places for overseas investors. In fact, if you’re building a large warehouse, they might be more attractive than the cities we’ve chosen.
But we wanted to look at places with a steady stream of FDI, places where any industry could find a home. We also wanted to look at places with larger and more diverse populations, which are more accessible and may feel more comfortable to people from all over the world.
We looked at Census place data because many factors — business regulation, office rent, school quality — vary drastically within a metropolitan area. Many New Yorkers probably wish they paid the housing costs of Newark, New Jersey, where prices are 61 per cent cheaper.
We used metropolitan-area data when city-level data was not available or when lines were more difficult to draw. Dallas and Fort Worth, for example, share the same international airport. The number of international flights out of Dallas-Fort Worth was assigned to both cities in our ranking.
Choosing the categories
The best place for foreign business is not one-size-fits-all. A fintech firm and a manufacturing plant will have very different priorities when it comes to what they’re looking for in a location.
Through an analysis of press releases, interviews and surveys, we identified and measured some common features of any city that make it shine for international business. Apart from access to specific markets, we found that skilled workers and a friendly business environment were top of the list for foreign investors. Below is more information on each category and how we chose to measure it.

Business environment
This category looks at taxes, regulation and costs. We compared cities by their corporate income tax, sales tax, property tax, tax incentives, rent and utility costs. We also conducted a survey with the State International Development Organizations (Sido) on how well city and state business policies supported FDI objectives.
Sources: Commercial Edge, FT-Nikkei and Sido Survey, GIS Planning, Sales Tax Clearinghouse, Tax Foundation, US Census, Wavteq
Foreign business needs
This category looks at how much cities’ policies and infrastructure help international business. In this category, we compared cities by their number of international flights, distance to a port, internet connectivity, and FDI services. We partnered with Sido to track how many employees cities and states have dedicated to attracting FDI, if they have investor platforms, and if they assist with site selection, market strategy, supply chain procurement, regulation, and mergers and acquisitions.
Sources: Broadband Now, FT-Nikkei and Sido survey, GIS Planning, OAG
Workforce and talent
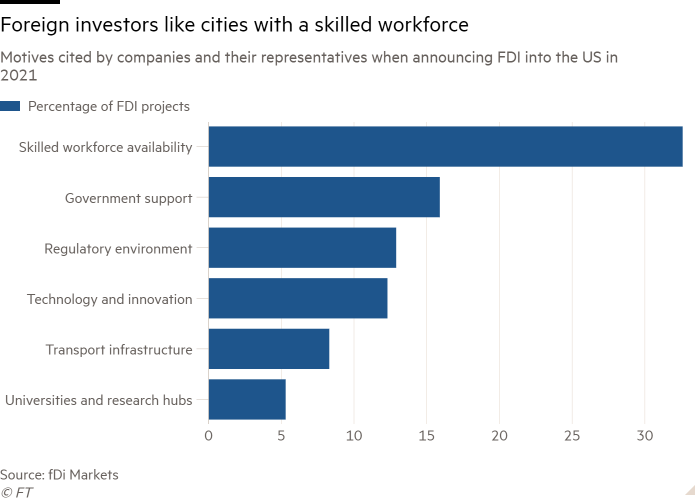
Talent is at the top of the list for foreign investors. Apart from proximity to customers, analysis by fDi Markets of corporate announcements showed that a skilled workforce was the most cited reason for FDI into the US in 2021.
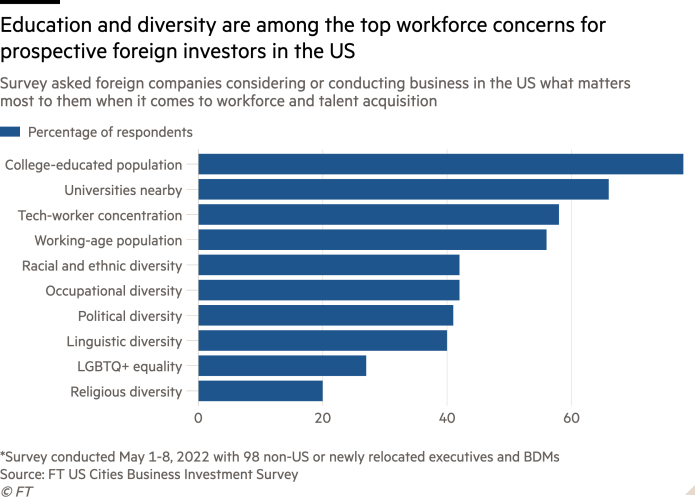
We compared cities by their share of college graduates, the size of their working age population, the number of nearby universities, and the freedom of their labour market. Labour market freedom refers to how much leeway the private sector has when it comes to hiring and remunerating workers. It is modelled after the economic freedom index compiled by Canadian think-tank the Fraser Institute and research by Dean Stansel, a professor at Southern Methodist University who also worked on the Fraser Institute’s index.
Sources: Economic Policy Institute, GIS Planning, Minimum-Wage.org, Unionstats.com, US Census

Quality of life
We focused here on the basics: cost of living, commute times, crime risk and school quality.
Many things matter to people when deciding on a place to live and work—good weather, access to nature, political affiliation, proximity to family and friends. Many of the positive factors that we would have liked to include would be hard to measure or difficult to update every year. With other factors, even denoting them as positive or negative would in effect be a political decision.
Sources: Applied Geographic Solutions, GIS Planning, Niche
Openness
This category looks at diversity. We measured cities by the size of their foreign-born population and their racial diversity score — the chance that people of different races will be selected in any random sample of two.
Source: US Census
Investment trends
This category looks at how well cities attracted investment in 2021. We compared cities based on their greenfield foreign and domestic direct investment per capita.
Source: fDi Markets
Aftercare
Ensuring companies are supported once they have been established can go a long way in attracting FDI. A quarter of all greenfield FDI projects in the US last year were expansions of existing investments.
Through our partnership with Sido, we surveyed cities on whether they had officials dedicated to supporting companies’ long-term needs and communicating regulatory changes. We also tracked whether they helped relocate and integrate workers, advised on new investments, or provided export and promotion services.
Sources: FT-Nikkei and SIDO survey
What about. . . ?
There were many variables we wanted to include that didn’t make the cut. There were also many variables that we didn’t have the opportunity to explore that we might have used. Ultimately, we built our ranking with variables that were relevant, timely and readily available.
We wanted to remain as objective as possible when measuring and ranking cities. The salience of issues in the political realm — abortion, gun control, marijuana legislation — is something that only individual businesses can decide.
Combining the data
A key challenge we faced in constructing the index was deciding how to combine different types of data. The variables in our dataset represent different kinds of things: people, money, distance, time. Some of the variables are percentages, some are scores on other indices, others are ordinal scales, where some cities score higher than others.
Each of these variables needs to be represented on the same scale, so that they can be added together. This is a different problem to deciding how much weight to give to different things. It’s about choosing how to represent different types of data in an equivalent way.
A common approach to this sort of task is to measure, for each variable, how far each city’s score falls from the average score, relative to the variation in the scores. This works well for variables that are symmetrically centred around the average, but it works less well for variables that don’t have this “normal” shape.
Imagine two variables where the scores fall between 0 and 100. In one, the average is 50 and most cities score between 30 and 70. In the other, most cities score between 0 and 20, but some cities score between 20 and 50, and a few outliers score between 50 and 100.
In the first case, roughly half the cities score below the average. In the second, more than half the cities score below the average. The median city — the one in the middle if you list them from lowest to highest score — will score lower in the second case than the first, and the best city will score higher. Some cities would gain an unfair advantage because of differences in the shape of the variables.
One way of dealing with this is to ignore the raw scores and instead use the ranks of the cities. This solves the problem of differently shaped data, but at a high cost, because you end up throwing away all of the information about the size of the differences between cities.
Ideally, you would like to strike a balance between these two extremes, and the approach we have taken aims to do just that. First, we transform skewed variables so that they have a more normal shape. Second, we measure the variation of the scores around the median rather than around the mean. Third, we place a limit on the minimum and maximum standardised scores, so any cities whose scores fall outside this range have their scores pulled into the edges.
This reduces the effect of differences in the distribution of variables, and stops outliers gaining a disproportionate advantage, while keeping much of the information about the size of the differences between the cities within each measure.
The standardised scores for the variables within each category are combined as a weighted sum to create a category index. Each category index is scaled from 0 to 100, and the overall score is a weighted sum of the category indices.
Comments