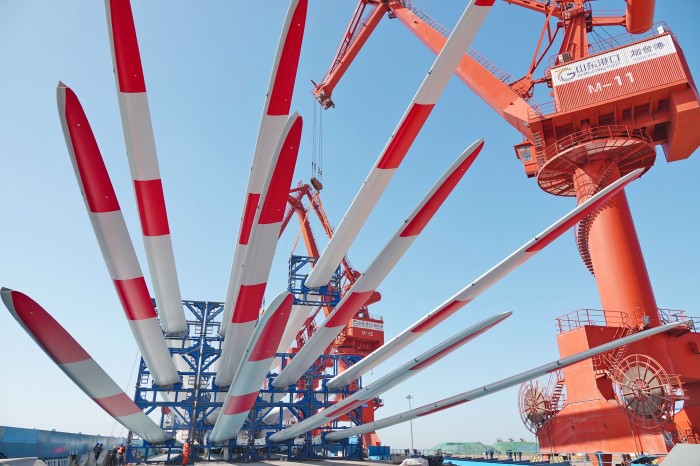
A crane loads red and white wind turbine blades on to a cargo ship in Yantai, China
Green economy: cranes load wind turbine blades on to a cargo ship in Yantai, China © Tang Ke/VCG via Getty Images

When it comes to climate policy, the companies in the second edition of Asia-Pacific Climate Leaders — compiled by the Financial Times and data provider Statista — confront a different world from their predecessors in the inaugural list a year ago.

In the US, Joe Biden’s Inflation Reduction Act, with its $369bn in support for green energy projects, has galvanised investment in clean technology — not only at home but also in the EU, where policymakers worry about manufacturers being lured to the US.

The resulting surge in demand will offer potential wins for countries rich in the minerals needed for electric vehicle batteries, such as Australia and, especially, Indonesia.

The past 12 months have brought better news for poorer countries, too, with November’s COP27 climate summit finally agreeing to establish a “loss and damage” fund to compensate developing nations hit by the effects of global warming. The move was described by Pakistan’s climate change minister Sherry Rehman as “an investment in climate justice” — although the realisation of the actual funds remains a matter of contention.

But some situations remain stubbornly unchanged. Following pressure from oil and gas producing countries, COP27 failed to move beyond the commitment to “phase down” — rather than “phase out” — coal power that had been agreed at the preceding summit, COP26. For all their clean tech knowhow, both China and Japan are still heavy users of coal-fired power — a reliance that put the latter at odds with other G7 members during the recent Hiroshima summit.

Greenhouse gas emissions keep climbing: according to the International Energy Agency, energy-related CO₂ emissions reached a record 36.8bn tonnes in 2022, with Asia-Pacific countries other than China contributing an increase of 229mn tonnes over 2021. Although China registered a slight decrease, it remains the world’s biggest emitter, at 12bn tonnes.

And scientists continue to warn that the average global temperature is still rising: this month the World Meteorological Organization said it was likely to pass the threshold of 1.5C above pre-industrial levels within the next five years.

So, while the 275 companies on the Climate Leaders list can take pride in their efforts to cut greenhouse gas emissions, there is no room for complacency. Pressure on governments and businesses to do more looks set to grow, especially as the adverse consequences of global warming — such as last year’s floods in Pakistan and the recent heatwave in Shanghai — become more apparent.

Asia-Pacific Climate Leaders 2023
Name for online publicationCountrySectorScoreReduction of core emissions intensity (Scope 1 and 2) YoY 2016-21 [1]2Core emissions intensity (GHGs in tonnes per $mn revenue) [2]Core emissions in tonnes (CO₂ equivalent) [2]Total reduction of core emissions [3]Scope 3 emissions reported? [4]CDP rating [5]Participation in Science Based Targets initiative (SBTi) [6]
Lenovo GroupHong KongTechnology & electronics79.7 [c]39.0%0.427,22985.9%YesA-Targets set, 1.5°C
WiproIndiaBusiness & professional services75.6 [c]25.4%7.682,54467.6%YesATargets set, 1.5°C
Nomura Research InstituteJapanBusiness & professional services75.1 [e]23.7%5.529,00062.8%YesATargets set, 1.5°C
New World DevelopmentHong KongProperty74.822.8%30.3265,37666.9%YesA-Targets set, 1.5°C
InfosysIndiaBusiness & professional services74.1 [d]23.5%3.760,68254.6%YesATargets set, well below 2°C
Chugai PharmaceuticalJapanPharmaceuticals73.819.3%8.069,65630.3%YesATargets set, 1.5°C
Bank AustraliaAustraliaFinancial services73.4 [a]44.8%0.46793.8%Yes-Targets set, 1.5°C
NTT DataJapanBusiness & professional services73.4 [c]18.0%6.3139,67945.4%YesATargets set, 1.5°C
BramblesAustraliaTransport & logistics73.4 [c]17.9%8.142,36064.9%YesATargets set, 1.5°C
Marui GroupJapanRetail & ecommerce73.217.2%22.340,52365.7%YesATargets set, 1.5°C
KB Financial GroupSouth KoreaFinancial services73.123.6%4.7132,4678.1%YesA-Targets set, 1.5°C
QBE Insurance GroupAustraliaInsurance72.929.8%0.46,88079.7%YesA--
AdvantestJapanTechnology & electronics72.9 [c]22.9%6.925,04027.0%YesA-Targets set, 1.5°C
Tech MahindraIndiaTechnology & electronics72.6 [c]18.7%10.966,84845.5%YesA-Targets set, 2°C
Macquarie GroupAustraliaFinancial services72.4 [d]38.0%3.316,35657.6%YesB-
Ono PharmaceuticalJapanPharmaceuticals72.4 [a]7.9%7.523,5002.1%YesATargets set, 1.5°C
Tata Consultancy ServicesIndiaBusiness & professional services72.3 [c]24.5%8.9232,89950.5%YesA-Committed
ShimadzuJapanHealthcare & medical technology72.3 [c]21.0%4.918,37161.4%YesA-Targets set, 1.5°C
KeppelSingaporeConstruction & building materials72 [c]36.8%24.6157,12287.2%YesB-
FujitsuJapanTechnology & electronics71.9 [e]12.9%15.7490,00060.1%YesATargets set, 1.5°C
KirinJapanFood, beverages & tobacco71.8 [c]6.1%45.6721,55336.0%YesATargets set, 1.5°C
HitachiJapanTechnology & electronics71.5 [c]4.9%38.23,410,00012.8%YesATargets set, 1.5°C
Sony GroupJapanTechnology & electronics71.4 [c]4.8%16.41,195,00013.7%Yes-Targets set, 1.5°C
LG ChemSouth KoreaChemicals & materials71.3 [c]14.4%288.210,339,701-13.8%YesA-Committed
HCL TechnologiesIndiaBusiness & professional services71.3 [c]20.9%13.4155,84113.7%YesBTargets set, 1.5°C
Fletcher BuildingNew ZealandConstruction & building materials71.2 [c]20.6%187.01,087,18171.7%YesA-Targets set, well below 2°C
HulicJapanProperty71.2 [c]17.2%7.428,84219.5%YesATargets set, 1.5°C
DexusAustraliaProperty71.1 [e]10.2%62.8107,05928.5%YesATargets set, 1.5°C
RicohJapanTechnology & electronics70.9 [c]9.7%16.6253,00048.0%YesATargets set, 1.5°C
MindtreeIndiaTechnology & electronics70.9 [a]29.6%3.14,37265.2%YesA--
ToshibaJapanTechnology & electronics70.8 [c]12.8%35.31,022,86265.5%YesA-Targets set, well below 2°C
ShiseidoJapanPersonal & household goods70.7 [c]9.1%7.565,48126.4%YesATargets set, 1.5°C
Ayala LandPhilippinesProperty70.6 [c]11.9%64.7134,55254.8%YesA-Committed
AjinomotoJapanFood, beverages & tobacco70.6 [a]8.6%161.41,611,95732.6%YesATargets set, 1.5°C
Sekisui HouseJapanConstruction & building materials70.411.3%3.988,18730.0%YesATargets set, well below 2°C
Hana Financial GroupSouth KoreaFinancial services70.48.0%8.168,9177.5%YesA-Targets set, 1.5°C
Dentsu GroupJapanMarketing, media & education70.321.0%2.624,10360.0%YesBTargets set, 2°C
EisaiJapanPharmaceuticals70.217.2%11.374,50145.4%YesA-Targets set, 2°C
Japan Metropolitan Fund InvestmentJapanProperty7036.7%42.329,76888.0%YesB-
BTS GroupThailandTransport & logistics7016.6%81.976,908-30.5%YesA-Committed
ASE Technology HoldingTaiwanTechnology & electronics709.9%82.71,702,640-23.0%YesA-Targets set, well below 2°C
PanasonicJapanTechnology & electronics703.2%32.12,060,00014.5%YesATargets set, 2°C
OmronJapanTechnology & electronics69.812.7%18.4122,04351.3%YesATargets set, 1.5°C
EpsonJapanTechnology & electronics69.812.7%35.5347,67144.1%YesATargets set, 1.5°C
Sunway ReitMalaysiaProperty69.835.9%122.019,73285.5%Yes-Committed
BenesseJapanMarketing, media & education69.712.4%1.24,57748.3%YesA-Targets set, 1.5°C
IGOAustraliaMetals & mining69.729.1%95.062,35961.6%YesB-
FlexSingaporeBusiness & professional services69.75.7%29.1756,73118.7%YesA-Targets set, 1.5°C
Delta ElectronicsTaiwanTechnology & electronics69.54.9%74.9850,985-13.9%YesATargets set, 1.5°C
LG ElectronicsSouth KoreaTechnology & electronics69.44.5%18.81,179,755-7.1%YesA-Targets set, 1.5°C
AstellasJapanPharmaceuticals69.311.1%10.5118,67945.1%YesA-Targets set, 1.5°C
NECJapanTechnology & electronics69.23.9%12.4324,0007.4%YesATargets set, 1.5°C
KuritaJapanChemicals & materials69.133.5%13.132,71582.5%YesB-
Hyundai E&CSouth KoreaConstruction & building materials6913.5%19.5296,84153.5%YesA-Committed
WistronTaiwanTechnology & electronics6920.1%4.7145,71657.5%YesACommitted
Woolworths GroupAustraliaRetail & ecommerce6910.1%45.42,010,03734.9%YesA-Targets set, 1.5°C
KAOJapanChemicals & materials68.93.1%68.6846,00018.7%YesATargets set, 1.5°C
Nan Ya PlasticsTaiwanChemicals & materials68.96.4%779.36,117,856-0.7%YesA-Targets set, well below 2°C
Nanya TechnologyTaiwanTechnology & electronics68.96.3%139.2430,048-48.3%YesA-Targets set, well below 2°C
Nippon YusenJapanTransport & logistics68.96.2%693.013,730,59314.0%YesATargets set, 2°C
Pola OrbisJapanPersonal & household goods68.89.3%5.17,98549.8%YesATargets set, 1.5°C
K LineJapanTransport & logistics68.712.5%506.06,596,97949.2%YesATargets set, 2°C
Mitsubishi MaterialsJapanChemicals & materials68.79.1%666.310,487,30513.9%YesA-Targets Set, 1.5°C
Renesas ElectronicsJapanTechnology & electronics68.719.1%109.8948,13926.8%YesBTargets set, 1.5°C
SimsAustraliaMetals & mining68.715.6%20.4137,56021.9%YesA--
Taiyo YudenJapanTechnology & electronics68.78.9%151.1459,0004.8%YesATargets set, 1.5°C
NabtescoJapanMachines & industrial equipment68.68.7%17.345,08222.4%YesATargets set, 1.5°C
ObayashiJapanConstruction & building materials68.68.6%11.7196,13834.7%YesATargets set, 1.5°C
Fuji OilJapanFood, beverages & tobacco68.511.8%107.1403,76121.0%YesA-Targets set, well below 2°C
ACCIndiaConstruction & building materials68.44.5%7,169.015,714,585-2.6%YesA-Targets set, well below 2°C
Tata CommunicationsIndiaTelecommunications68.327.8%40.793,05281.4%YesBCommitted
Goodman GroupAustraliaProperty68.320.9%9.714,74260.7%YesNot scored (F)Targets set, 1.5°C
First Financial HoldingTaiwanFinancial services68.210.7%9.721,89214.3%YesACommitted
Shinhan Financial GroupSouth KoreaFinancial services68.27.3%2.596,6102.0%YesA-Targets set, 1.5°C
Taiwan MobileTaiwanTelecommunications68.23.9%48.9275,302-9.5%YesATargets set, well below 2°C
Brother GroupJapanTechnology & electronics68.210.5%20.1124,00036.4%YesBTargets set, 1.5°C
JSW EnergyIndiaEnergy & utilities68.13.8%12,916.415,119,95415.2%YesA-Committed
Transurban GroupAustraliaTransport & logistics68.17.1%43.0106,39213.7%YesATargets set, 1.5°C
Fisher & Paykel HealthcareNew ZealandHealthcare & medical technology68.16.9%10.512,086-31.3%YesA-Targets set, 1.5°C
FujifilmJapanTechnology & electronics683.4%48.01,053,0008.5%YesATargets set, well below 2°C
Tokio MarineJapanInsurance689.9%1.260,45733.5%YesA-Committed
Cathay FinancialTaiwanFinancial services683.2%8.059,974-4.4%YesATargets set, well below 2°C
Bendigo and Adelaide BankAustraliaFinancial services67.919.7%0.810,50264.6%YesBCommitted
Amp GroupAustraliaFinancial services67.913.0%2.64,98857.9%YesA--
Toyota MotorJapanAutomobiles & components67.96.3%23.76,460,00017.9%YesA-Targets set, 1.5°C
Japan TobaccoJapanFood, beverages & tobacco67.86.1%32.9665,00020.7%YesATargets set, 1.5°C
Sinyi RealtyTaiwanProperty67.816.1%9.46,348-3.1%YesBTargets set, 1.5°C
NGK InsulatorsJapanChemicals & materials67.79.1%143.0634,00021.1%YesA-Committed
TDKJapanTechnology & electronics67.68.5%103.01,701,477-3.3%YesA-Committed
Tokyo ElectronJapanTechnology & electronics67.424.6%4.986,00039.0%YesBCommitted
Dr Reddy’s LaboratoriesIndiaPharmaceuticals67.47.9%158.8468,713-1.7%YesA-Targets set, well below 2°C
SCSKJapanBusiness & professional services67.34.5%11.139,844-0.1%YesA-Targets set, 1.5°C
Kyushu Electric PowerJapanEnergy & utilities67.37.8%1,154.917,490,05036.4%YesA-Targets set, well below 2°C
Daiwa Securities GroupJapanFinancial services67.311.1%3.720,04244.1%YesA-
National Australia BankAustraliaFinancial services67.110.2%7.171,03537.7%YesA-
AcerTaiwanTechnology & electronics6713.2%1.213,29732.4%YesA-Committed
AnritsuJapanTechnology & electronics66.96.3%13.612,43112.9%YesA-Targets set, 2°C
Daiichi SankyoJapanPharmaceuticals66.96.2%21.1191,39920.7%YesATargets set, well below 2°C
Furukawa ElectricJapanTechnology & electronics66.86.0%79.2640,00019.0%YesA-Targets set, well below 2°C
AsusTaiwanTechnology & electronics66.822.6%0.917,25568.2%YesBCommitted
Asia CementTaiwanConstruction & building materials66.75.7%1,492.34,830,000-9.9%YesA-Targets set, well below 2°C
Mitsubishi ElectricJapanTechnology & electronics66.55.0%28.21,095,00018.3%YesA-Targets set, 2°C
Dai Nippon PrintingJapanBusiness & professional services66.55.0%69.1800,62826.6%YesATargets set, well below 2°C
MitsubishiJapanAutomobiles & components66.44.7%152.422,851,766-111.3%YesA-Targets set, 2°C
Toyota IndustriesJapanMachines & industrial equipment66.411.3%35.4831,41711.5%YesACommitted
Mitsui OSK LinesJapanTransport & logistics66.48.0%920.610,151,07244.4%YesA--
Shree CementIndiaConstruction & building materials66.44.6%7,707.616,066,000-23.1%YesA-Targets set, 2°C
KomatsuJapanMachines & industrial equipment66.34.3%18.9461,100-24.5%YesATargets set, well below 2°C
Coca-Cola Bottlers JapanJapanFood, beverages & tobacco66.213.9%52.1355,71419.0%YesA-
JSW SteelIndiaMetals & mining66.213.8%2,254.144,211,310-14.8%YesA-
Tokyo Steel ManufacturingJapanConstruction & building materials66.110.5%1,416.383,770,00015.4%YesACommitted
Daikin IndustriesJapanMachines & industrial equipment66.113.7%42.91,159,21427.1%YesA-
True CorporationThailandTelecommunications66.13.5%99.3429,7893.8%YesA-Committed
MS&AD Insurance GroupJapanInsurance6610.0%1.671,49133.8%YesA-Committed
United MicroelectronicsTaiwanTechnology & electronics663.2%312.71,797,3460.3%YesATargets set, well below 2°C
CanonJapanTechnology & electronics65.93.1%32.4989,93811.5%YesA-Committed
HakuhodoJapanMarketing, media & education65.812.8%1.29,570-81.5%YesA--
OtsukaJapanTechnology & electronics65.712.3%2.518,78931.2%YesBCommitted
InventecTaiwanTechnology & electronics65.612.1%5.4100,90036.3%YesBCommitted
E InkTaiwanTechnology & electronics65.511.7%64.845,99624.5%YesBCommitted
ComanyJapanConstruction & building materials65.48.0%16.24,54631.5%YesBTargets set, 1.5°C
DaifukuJapanMachines & industrial equipment65.411.3%7.834,70512.4%YesA--
MaricoIndiaPersonal & household goods65.314.4%8.510,99726.8%YesB-
Aeon MallJapanRetail & ecommerce65.17.1%84.4205,79115.6%YesA-Committed
Insurance Australia GroupAustraliaInsurance65.113.7%2.715,77155.4%YesB-
T&DJapanInsurance65.110.4%1.943,98823.5%YesA--
TSMCTaiwanTechnology & electronics65.13.7%179.810,304,434-39.0%YesA--
Kasikornbank PublicThailandFinancial services653.2%18.390,1739.6%YesA-
Yue Yuen IndustrialHong KongPersonal & household goods6513.2%50.2428,00050.4%YesB-
QisdaTaiwanTechnology & electronics64.93.1%13.1106,671-49.1%YesBCommitted
Lixil GroupJapanConstruction & building materials64.96.3%78.2936,00044.3%YesBTargets set, 1.5°C
Dai-Ichi LifeJapanInsurance64.99.6%2.7105,20031.8%YesA-
ScreenJapanTechnology & electronics64.89.4%12.544,66116.3%YesBTargets set, well below 2°C
Santen PharmaceuticalJapanPharmaceuticals64.75.5%14.433,345-0.7%YesBTargets set, 1.5°C
NGK Spark PlugJapanAutomobiles & components64.58.5%62.1265,40015.3%YesBTargets set, well below 2°C
Industrial Bank of KoreaSouth KoreaFinancial services64.55.1%7.056,79513.0%YesACommitted
Spark New ZealandNew ZealandTelecommunications64.44.7%8.821,57019.2%YesBTargets set, 1.5°C
Hamamatsu PhotonicsJapanTechnology & electronics64.47.9%34.951,3058.3%YesBTargets set, well below 2°C
Sega Sammy HoldingsJapanTechnology & electronics64.417.9%11.231,16067.4%YesB-
Australia PostalAustraliaTransport & logistics64.37.6%39.4257,13211.0%YesBTargets set, well below 2°C
BNK Financial GroupSouth KoreaFinancial services64.37.5%9.329,9895.2%YesBCommitted
Nissan ChemicalJapanChemicals & materials64.27.4%191.1345,33621.6%YesA--
Hyundai GlovisSouth KoreaTransport & logistics64.27.4%211.03,865,7083.3%YesA--
KubotaJapanMachines & industrial equipment64.27.2%32.1613,0005.3%YesA--
OlympusJapanTechnology & electronics64.17.1%11.990,11918.7%YesA--
Compal ElectronicsTaiwanTechnology & electronics64.16.9%5.2232,413-12.8%YesBCommitted
Yokogawa ElectricJapanTechnology & electronics643.5%20.870,48616.5%YesBTargets set, 1.5°C
WorleyAustraliaBusiness & professional services6410.1%7.754,489-9.3%YesB-
Minebea MitsumiJapanMachines & industrial equipment63.96.5%95.0927,400-25.8%YesA--
Alps AlpineJapanTechnology & electronics63.96.2%31.5219,42522.6%YesA--
TeijinJapanChemicals & materials63.96.2%171.51,380,0009.2%YesBTargets set, well below 2°C
JFEJapanMetals & mining63.86.1%1,555.959,000,0003.8%YesA--
President Chain StoreTaiwanRetail & ecommerce63.86.1%52.3496,18610.8%YesA--
ResonaJapanFinancial services63.75.6%7.152,65116.6%YesA--
Sekisui ChemicalJapanChemicals & materials63.75.6%70.7711,00018.6%YesBTargets set, 2°C
DICJapanChemicals & materials63.75.6%76.7569,84714.7%YesBTargets set, well below 2°C
EspecJapanMachines & industrial equipment63.712.2%20.77,54144.8%YesBCommitted
MurataJapanTechnology & electronics63.65.4%88.91,400,000-20.9%YesA--
Yamaha MotorJapanAutomobiles & components63.65.4%31.8500,9038.6%YesA--
TakasagoJapanChemicals & materials63.65.4%43.661,57910.0%YesBTargets set, well below 2°C
Vanguard International SemiconductorTaiwanTechnology & electronics63.65.2%596.0945,614-30.5%YesA--
MTR CorporationHong KongTransport & logistics63.44.7%177.71,076,26518.0%YesBCommitted
Warehouse GroupNew ZealandRetail & ecommerce63.48.0%5.512,29227.3%Yes--
ToyoboJapanChemicals & materials63.34.5%275.7900,0009.3%YesBTargets set, well below 2°C
GS YuasaJapanTechnology & electronics63.34.5%160.5602,4924.3%YesA--
Scentre GroupAustraliaProperty63.34.4%127.2210,92227.7%YesA--
SysmexJapanHealthcare & medical technology63.311.0%6.319,92418.8%YesBCommitted
UnionBankPhilippinesFinancial services63.344.2%1.61,38590.3%No--
Charoen Pokphand FoodsThailandAgriculture63.13.5%54.2863,0004.9%YesBCommitted
Japan Post BankJapanFinancial services6313.4%1.526,27149.2%YesB-
SapporoJapanFood, beverages & tobacco633.4%47.1178,94832.0%YesBCommitted
NSKJapanMachines & industrial equipment633.3%101.5763,00023.0%YesA--
Hang Seng BankHong KongFinancial services639.9%2.516,04333.2%YesBCommitted
KEPCOSouth KoreaEnergy & utilities636.5%19.71,004,32928.1%YesB-
NichireiJapanFood, beverages & tobacco62.86.1%43.5228,00018.3%YesB-
Godrej IndustriesIndiaChemicals & materials62.89.3%40.080,825-6.9%YesBCommitted
Sumitomo Dainippon PharmaJapanPharmaceuticals62.89.2%12.761,74916.0%YesBCommitted
BiprogyJapanTechnology & electronics62.78.9%4.713,06329.3%YesBCommitted
IbidenJapanTechnology & electronics62.612.2%166.7581,00021.3%YesB-
Nankai Electric RailwayJapanTransport & logistics62.65.4%118.5207,65231.2%YesB-
StocklandAustraliaProperty62.511.8%30.462,83844.5%YesNot scored (F)Committed
CTBC BankTaiwanFinancial services62.55.0%11.242,1947.9%YesB-
IndusInd BankIndiaFinancial services62.411.5%22.667,914-19.0%YesB-
Globe TelecomPhilippinesTelecommunications62.421.4%35.1115,40260.2%NoBCommitted
SumcoJapanTechnology & electronics62.210.8%287.7839,00010.3%YesB--
Pou ChenTaiwanPersonal & household goods62.210.6%49.0424,50050.1%YesB-
Tung Ho SteelTaiwanMetals & mining62.210.6%415.7882,399-33.5%YesB-
SinoPac HoldingsTaiwanFinancial services62.110.3%22.317,81922.8%Yes-Committed
KokuyoJapanPersonal & household goods62.13.6%13.036,26515.6%YesB-
FujikuraJapanPersonal & household goods626.8%21.3123,76627.7%YesBCommitted
Ricoh LeasingJapanFinancial services623.4%0.495612.2%YesB-
Mizuho Financial GroupJapanFinancial services61.99.8%45.7150,98733.4%YesB-
Fukuoka Financial GroupJapanFinancial services61.99.6%10.224,84828.4%YesB-
Samsung SDSSouth KoreaBusiness & professional services61.99.6%8.9101,885-0.6%YesB-
Galaxy SurfactantsIndiaMetals & mining61.96.3%116.357,630-23.3%YesB-Committed
Ramsay Health CareAustraliaHealthcare & medical technology61.99.5%16.6165,6664.3%YesNot scored (F)Committed
SGJapanTransport & logistics61.712.4%28.6394,54412.1%Yes--
DiscoJapanTechnology & electronics61.79.1%22.750,090-17.6%YesB--
KOAJapanTechnology & electronics61.79.1%100.456,63111.4%YesB-
Mitsubishi Heavy IndustriesJapanMachines & industrial equipment61.68.7%15.4515,75437.4%YesB-
AdekaJapanChemicals & materials61.68.6%48.1150,800-3.0%YesB-
LS Cable & SystemSouth KoreaMachines & industrial equipment61.518.4%21.4110,22828.2%Yes--
Westpac BankingAustraliaFinancial services61.58.4%6.397,11234.7%Yes-Committed
Sumitomo Mitsui TrustJapanFinancial services61.37.7%2.530,35225.7%YesB-
Vicinity CentersAustraliaProperty61.37.7%144.5124,22139.6%YesNot scored (F)Committed
Home Product Center PublicThailandRetail & ecommerce61.27.4%33.564,50828.7%YesNot scored (F)Committed
Nippon ShinyakuJapanPharmaceuticals61.27.3%8.19,6854.7%YesB-
Tata MotorsIndiaAutomobiles & components61.23.8%9.5357,30415.9%YesBCommitted
Sawai GroupJapanPharmaceuticals616.8%38.064,002-3.1%YesB-
PegatronTaiwanTechnology & electronics613.3%11.3514,3597.6%YesB-Committed
Suncorp GroupAustraliaFinancial services616.5%2.121,86134.6%YesB-
China Petrochemical DevelopmentTaiwanChemicals & materials60.96.4%1,502.91,907,8060.5%YesB-
Nippon Light MetalJapanChemicals & materials60.96.3%172.9731,00021.7%YesB-
Nippon PaintJapanChemicals & materials60.86.1%5.043,115-54.8%YesB-
Powertech TechnologyTaiwanTechnology & electronics60.75.7%132.1399,719-29.1%YesB-
Toyoda GoseiJapanAutomobiles & components60.65.2%65.3471,00015.9%YesB-
Incitec PivotAustraliaChemicals & materials60.55.0%516.81,633,624-0.5%YesB-
SharpJapanTechnology & electronics60.34.5%45.4985,0003.1%Yes-Targets set, well below 2°C
Mazda MotorJapanAutomobiles & components60.34.3%21.1588,52019.8%YesB-
Yarra Valley WaterAustraliaEnergy & utilities60.314.3%22.017,40748.9%Yes-Committed
DuskinJapanPersonal & household goods60.34.2%19.727,87018.8%YesB-
CalbeeJapanFood, beverages & tobacco60.24.1%86.7184,81821.0%YesB-
Nihon KohdenJapanHealthcare & medical technology60.24.0%8.014,334-0.4%YesB-
KiswireSouth KoreaChemicals & materials60.214.0%7.9276,245-7.2%Yes--
Apollo TyresIndiaAutomobiles & components60.23.9%263.8740,536-21.0%YesB-
Concordia Financial GroupJapanFinancial services60.13.8%6.917,30728.2%YesB-
YamatoJapanTransport & logistics603.4%59.6928,761-2.8%YesB-
Sumitomo Life InsuranceJapanInsurance603.3%1.031,96831.2%YesB-
Jubilant PharmovaIndiaPharmaceuticals603.2%85.170,03013.5%YesB-
FanclJapanPersonal & household goods603.2%11.910,7418.2%YesB-
Meritz SecuritiesSouth KoreaFinancial services59.632.2%0.11,63832.5%NoNot scored (F)-
Super Retail GroupAustraliaRetail & ecommerce59.210.6%23.460,37417.7%YesNot scored (F)-
TE ConnectivitySingaporeTechnology & electronics59.110.3%32.7361,33829.1%Yes--
Kiwi Property GroupNew ZealandProperty59.16.9%11.21,89240.6%YesNot scored (F)Committed
Bharat ForgeIndiaMetals & mining58.99.6%167.3238,8724.5%NoB-Committed
Fortune Parts IndustryThailandAutomobiles & components58.75.7%127.78,22021.3%Yes-Targets set, 1.5°C
MetcashAustraliaRetail & ecommerce58.68.8%6.773,65932.1%YesB-
Hanwha Investment&SecuritiesSouth KoreaFinancial services58.427.8%0.71,18876.3%NoNot scored (F)-
New Zealand PostNew ZealandTransport & logistics583.4%8.56,0481.9%Yes-Targets set, 1.5°C
Northern Star ResourcesAustraliaMetals & mining57.65.4%352.9958,234-225.0%Yes--
OZ MineralsAustraliaMetals & mining57.615.4%226.2344,622-3.3%YesNot scored (F)-
Aditya Birla Fashion and RetailIndiaRetail & ecommerce57.65.2%37.441,2265.1%YesNot scored (F)-
Teachers Mutual BankAustraliaFinancial services57.615.2%8.61,10846.1%No-Committed
Sun Hung Kai PropertiesHong KongProperty57.17.1%25.4253,01331.1%YesNot scored (F)-
RHB BankMalaysiaFinancial services57.13.6%78.323,96541.5%YesNot scored (F)-
AntamIndonesiaMetals & mining56.722.4%2.31,181,741-18.8%NoNot scored (F)-
Charter-HallAustraliaProperty56.321.0%81.598,747-20.8%NoNot scored (F)-
GPT ManagementAustraliaProperty563.3%483.979,51836.8%YesNot scored (F)-
GrainCorpAustraliaAgriculture55.618.7%32.2128,58953.0%NoNot scored (F)-
TronoxAustraliaMetals & mining55.618.6%184.0657,2662.2%NoNot scored (F)-
South East WaterAustraliaEnergy & utilities55.37.6%27.128,57730.8%No-Committed
Bank of China (Hong Kong)Hong KongFinancial services556.6%8.945,84522.0%Yes--
Mackay SugarAustraliaFood, beverages & tobacco54.916.4%159.659,77157.7%No--
Mercuries Life InsuranceTaiwanInsurance54.96.3%2.311,89340.7%Yes--
Siam MakroThailandRetail & ecommerce54.96.2%31.3251,517-12.0%YesNot scored (F)-
Monash HealthAustraliaHealthcare & medical technology54.715.8%36.779,73624.0%No--
BrickworksAustraliaConstruction & building materials54.78.9%350.4278,42518.6%NoNot scored (F)-
Kyushu RailwayJapanTransport & logistics54.65.4%90.5259,00034.8%NoB--
Gigabyte TechnologyTaiwanTechnology & electronics54.615.2%6.829,938-2.2%No--
Siliconware Precision IndustriesTaiwanTechnology & electronics54.34.2%150.4585,631-2.3%Yes--
Daido SteelJapanMetals & mining54.23.9%218.21,004,0002.4%NoB-
SunRiceAustraliaFood, beverages & tobacco54.13.7%72.970,6810.7%No-Committed
Air New ZealandNew ZealandTransport & logistics543.5%775.71,335,91259.7%No-Targets set, well below 2°C
Nippon ExpressJapanTransport & logistics543.2%49.4757,10219.7%NoB-
Harvey NormanAustraliaRetail & ecommerce53.912.9%48.999,84823.0%NoNot scored (F)-
Grange ResourcesAustraliaMetals & mining53.812.8%470.3267,227-43.0%No--
KAMCOSouth KoreaFinancial services53.612.0%7.14,150-4.6%No--
Hong Leong AsiaSingaporeMachines & industrial equipment53.611.9%475.11,726,15320.6%No--
Aeris ResourcesAustraliaMetals & mining53.611.8%364.1102,322-22.5%No--
Sonic HealthcareAustraliaHealthcare & medical technology53.511.7%9.765,7622.3%NoNot scored (F)-
Toll GroupAustraliaTransport & logistics53.210.7%2.7263,21851.8%No--
Sandfire ResourcesAustraliaMetals & mining53.210.6%92.685,443-2.6%No--
Essential EnergyAustraliaEnergy & utilities52.99.5%476.7555,53324.7%No--
Telkom IndonesiaIndonesiaTelecommunications52.79.0%28.2283,77423.3%NoNot scored (F)-
WesfarmersAustraliaRetail & ecommerce52.58.4%51.41,376,23165.3%NoNot scored (F)-

In order to reflect this more challenging environment, the FT and Statista have tightened the Climate Leaders methodology.

In the previous edition, the companies listed were simply those that achieved the greatest reduction in their Scope 1 and 2 greenhouse gas (GHG) emissions intensity over a five-year period. Scope 1 and 2 emissions — “core emissions” in the table — come respectively from a company’s own operations and from the energy it uses, while intensity is defined as tonnes of emissions of CO₂-equivalent per $1mn of revenue. Scope 3 emissions, which arise elsewhere in companies’ value chains, are harder to factor in. There is no standard metric and reliable data from suppliers and customers may be elusive, so companies do not always disclose them. Yet they typically far outweigh Scope 1 and 2 emissions and mandatory reporting — detailed in new guidance from global standard-setter the International Sustainability Standards Board — looks inevitable in many jurisdictions.

So, this year, we have not only calculated companies’ performance in cutting their Scope 1 and 2 emissions intensity, for the period 2016-21, but have also assigned a score to reflect their transparency on Scope 3, plus other indicators of commitment to reducing emissions. These indicators include collaboration with environmental performance monitor CDP, and with the Science Based Targets initiative (SBTi), which assesses emissions reduction plans.

These two factors — reduction of emissions intensity, and the commitment criteria, weighted at 80 per cent and 20 per cent respectively — are combined to produce an overall score for each company.

The editors reserved the right to exclude companies if their broader environmental record — on non-GHG pollution, for example, or deforestation — was sufficiently disputed to undermine any claim to be a “climate leader”. Energy companies prospecting for new fossil fuel reserves fell into this category.

The business with the highest score was Hong Kong-listed computer maker Lenovo Group, with 79.7 points, followed by two professional services companies: India’s Wipro (75.6 points) and Japan’s Nomura Research Institute (75.1 points).

Like last year, the technology and electronics industry accounted for the greatest number of companies in the list, with 57, followed by financial services, with 34. The top two countries also remained the same, with Japan home to 130 companies and Australia to 46.

Although the revised methodology — further details of which can be found in the panel below and on Statista’s website — means it is now harder to become a climate leader, the list still has shortcomings. In particular, because the intensity calculation is based on emissions relative to revenue, some rapidly growing companies on the list actually increased their absolute emissions over the five-year period but achieved a relative cut.

What is more, some of the key data this research relies on — companies’ own carbon accounting, plus information submitted to CDP — may also be flawed, whether because of inconsistent emissions figures or insufficient detail on carbon offsets.

To help compensate for this, the figures reported for 2016 and 2021 by some of the biggest emissions cutters, in terms both of intensity and absolute emissions, have been scrutinised by GreenWatch, a sustainability research team based at University College Dublin. Its findings have been added to the table as footnotes.

Whether climate policy continues to evolve as quickly over the next 12 months as it has over the past 12 remains to be seen. But, as global temperatures rise, consumers and policymakers are ever less likely to give corporate emitters an easy ride.

A print and online report on the Asia-Pacific Climate Leaders 2023 will be published on June 15, containing articles analysing the issues that this research raises
Footnotes

[1] Compound annual reduction rate (CARR) based on the sum of Scope 1 and 2 emissions and adjusted by revenue growth between 2016-2021.

[2] Calculated for 2021.

[3] Absolute change in GHG emissions between 2016 and 2021. Positive values reflect a reduction in emissions, negative values an increase. All the companies on the list have, however, cut their emissions intensity.

[4] Within annual report or sustainability report; some companies do, however, supply Scope 3 figures to CDP (see note 5). Scope 3 refers to indirect emissions, which can be reported for some or all of 15 categories and thus vary enormously. This is why absolute figures are left out here.

[5] CDP is a non-profit organisation that assesses how well companies and other bodies report on and reduce their environmental impact.

[6] SBTi is a partnership between CDP, the UN Global Compact, the World Resources Institute and WWF and helps companies set targets for reducing greenhouse gas emissions.


GreenWatch assessment

[a] This company’s core emissions intensity performance might have been different if the Scope 1 and 2 emissions detailed in its annual report were fully consistent with the figures it submitted to CDP, and if it had provided more comprehensive disclosures on the use of renewable energy products to offset Scope 2 emissions.

[b] This company’s core emissions intensity performance might have been different if the Scope 1 and 2 emissions detailed in its annual report were fully consistent with the figures it submitted to CDP.

[c] This company’s core emissions intensity performance might have been different if the Scope 2 emissions detailed in its annual report were fully consistent with the figures it submitted to CDP, and if it had provided more comprehensive disclosures on the use of renewable energy products to offset Scope 2 emissions.

[d] This company’s core emissions intensity performance might have been different if the Scope 2 emissions detailed in its annual report were fully consistent with the figures it submitted to CDP.

[e] This company’s core emissions intensity performance might have been different if additional information about the use of renewable energy products to offset Scope 2 emissions had been disclosed.

[f] Having reviewed this entry, GreenWatch does not have a material comment on this company’s core emissions intensity performance.

Methodology

Asia-Pacific Climate Leaders 2023 is a list of 275 Asia-Pacific companies that have achieved the greatest reduction in their greenhouse gas (GHG) emissions intensity and made further climate-related commitments. These two factors are combined to produce an overall score for each company.

For the first of these, the compilers looked for the businesses whose GHG emissions intensity fell the most between 2016 and 2021. Emissions intensity is defined as tonnes of Scope 1 and Scope 2 emissions of CO₂-equivalent per $1mn in revenue. The 2016 and 2021 figures were used to calculate the compound annual rate of reduction, expressed as a percentage, which contributed 80 per cent of the overall score.

For the second, the compilers assigned a score based on: transparency and extent of Scope 3 emissions reporting; use of offsets; and collaboration with CDP and SBTi. This accounted for 20 per cent of the overall score

All Asia-Pacific companies — defined as having headquarters in one of 14 Asia-Pacific countries — with a minimum revenue of $50mn in 2021 were eligible for consideration.

A call for entries in November 2022 invited prospective participants to complete a short questionnaire about their GHG emissions between 2016 and 2021, and their revenue over the same period (or, for banks and insurance companies, total income). Statista also conducted independent research, scrutinising data from about 1,500 companies and inviting possible candidates to register.

For businesses with a rating from CDP, only those with a score of at least B- were considered. Companies that do not work with CDP were still eligible, but for any company annually emitting more than 2mn tonnes of CO₂-equivalent, a CDP rating of at least A- was mandatory.

The editors also reserved the right to exclude companies if their broader environmental records, beyond reported Scope 1 and 2 emissions, were sufficiently disputed to undermine any claim to be a “climate leader”.

All companies for which relevant data was found — both those that registered and those independently identified — were contacted so that they could review the data. Of those, the 275 with the greatest reduction in emissions intensity have made it into the final list of Asia-Pacific Climate Leaders 2023.

Fuller information about the methodology is available from Statista. Although extensive research was carried out, the list does not claim to be complete, as some companies did not publish their figures or did not participate.

Copyright The Financial Times Limited 2024. All rights reserved.
Reuse this content (opens in new window) CommentsJump to comments section

Follow the topics in this article

Comments